Debugging Langfuse traces with Rewind
Langfuse captures what your agent did. But when a trace shows a failure at step 15 of a 30-step run, you can’t fix it without re-running everything. Rewind bridges that gap: import a Langfuse trace by ID, fork at the failure, replay with your fix, and prove it works with LLM-as-judge scoring. This guide walks through the full workflow.
Prerequisites
pip install rewind-agentYou’ll need your Langfuse API keys (from Settings > API Keys in the Langfuse dashboard):
export LANGFUSE_PUBLIC_KEY=pk-lf-...
export LANGFUSE_SECRET_KEY=sk-lf-...
Works with Langfuse Cloud and self-hosted instances. For self-hosted, set the host:
export LANGFUSE_HOST=https://your-langfuse.example.com
# or pass --host https://your-langfuse.example.com to each command
Import a trace
Find the failing trace in Langfuse’s UI and copy the trace ID. Then:
rewind import from-langfuse --trace <trace-id>Rewind calls Langfuse’s REST API, fetches the trace with all observations (generations, spans, events), converts them to Rewind’s internal format, and creates a browsable session.
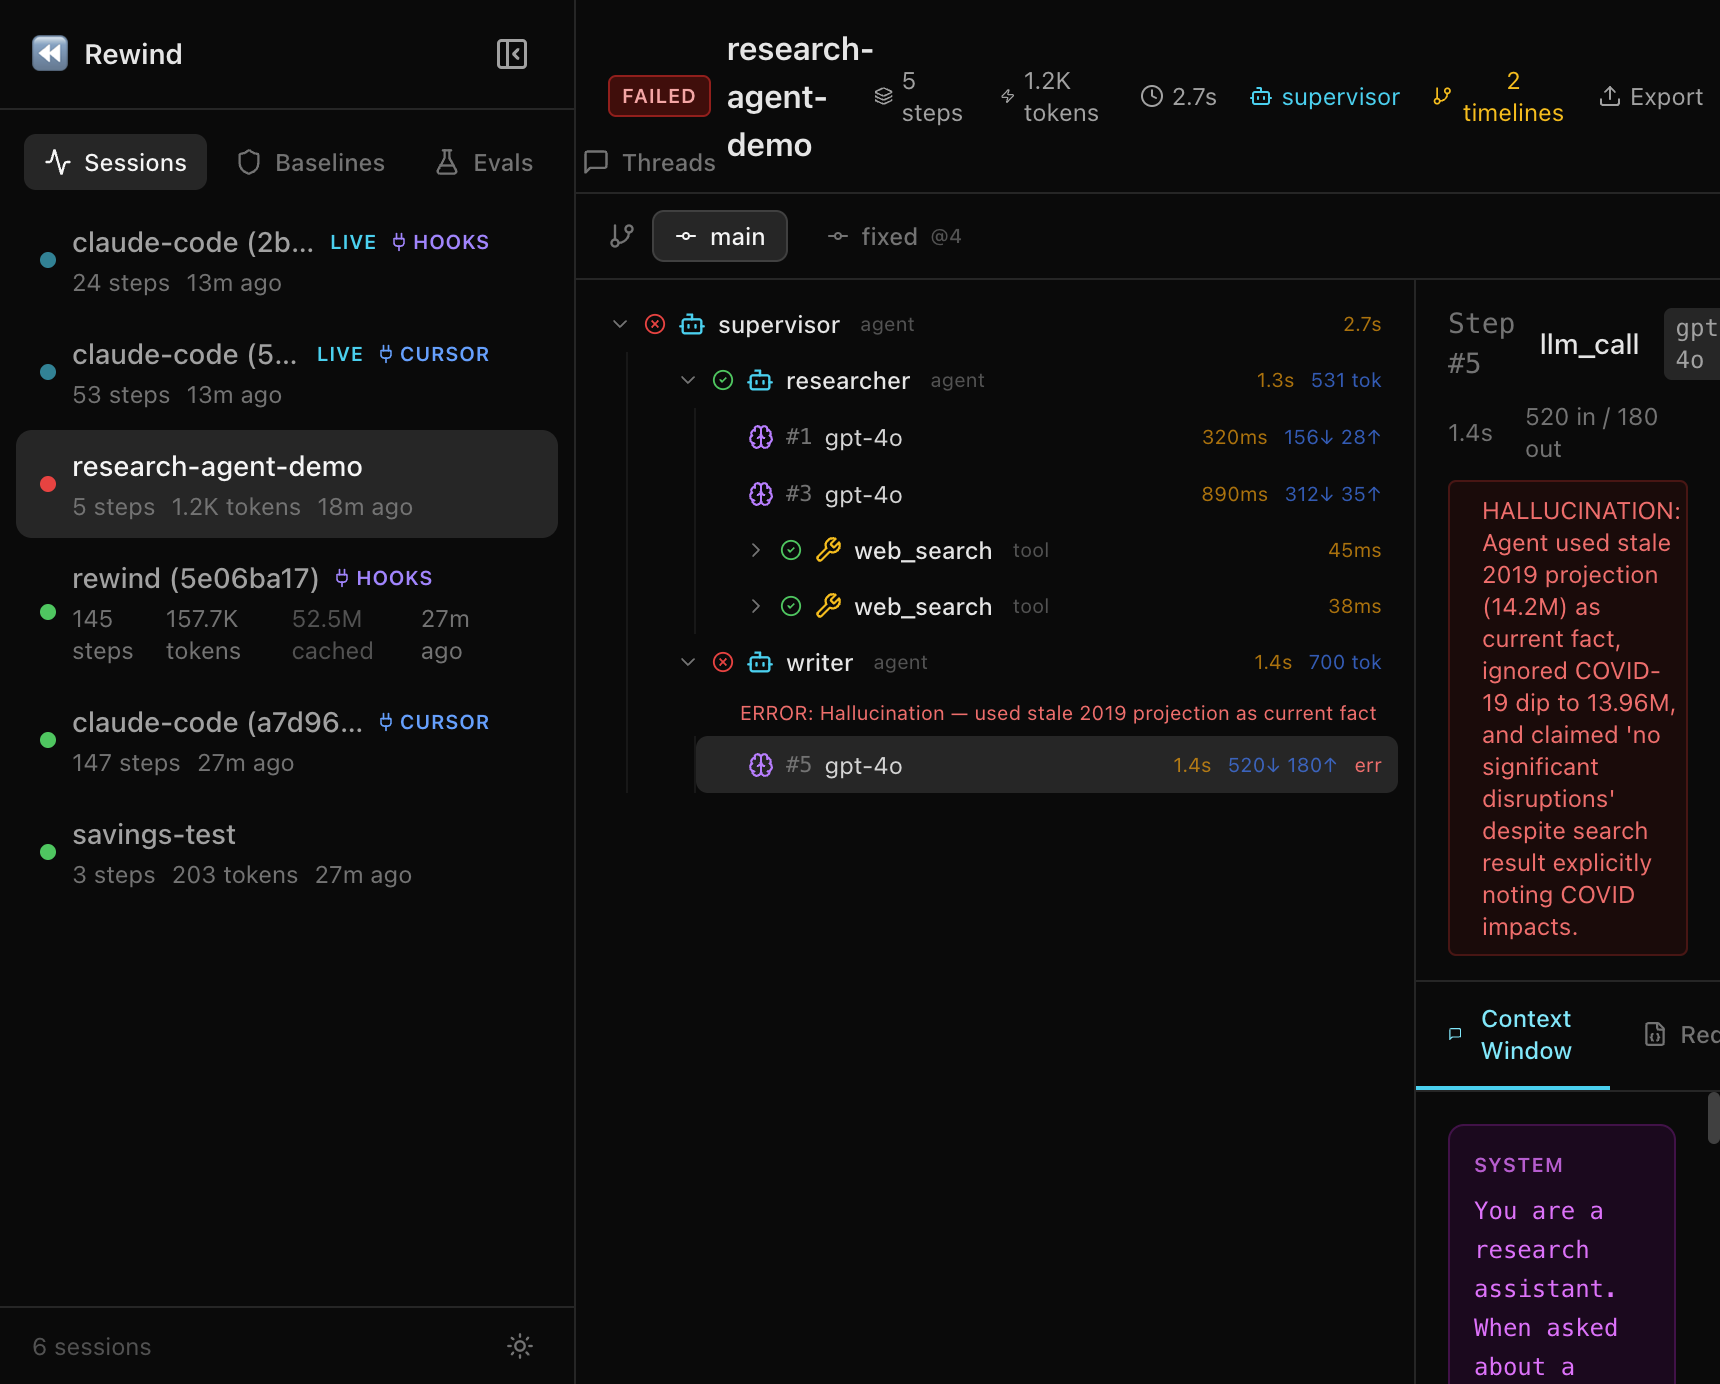
rewind show latestThis shows the full span tree with agent boundaries, tool calls, models, durations, and token counts at each step.
You can also open the web dashboard for an interactive view:
rewind web --port 8080
# open http://127.0.0.1:8080
Fork and replay
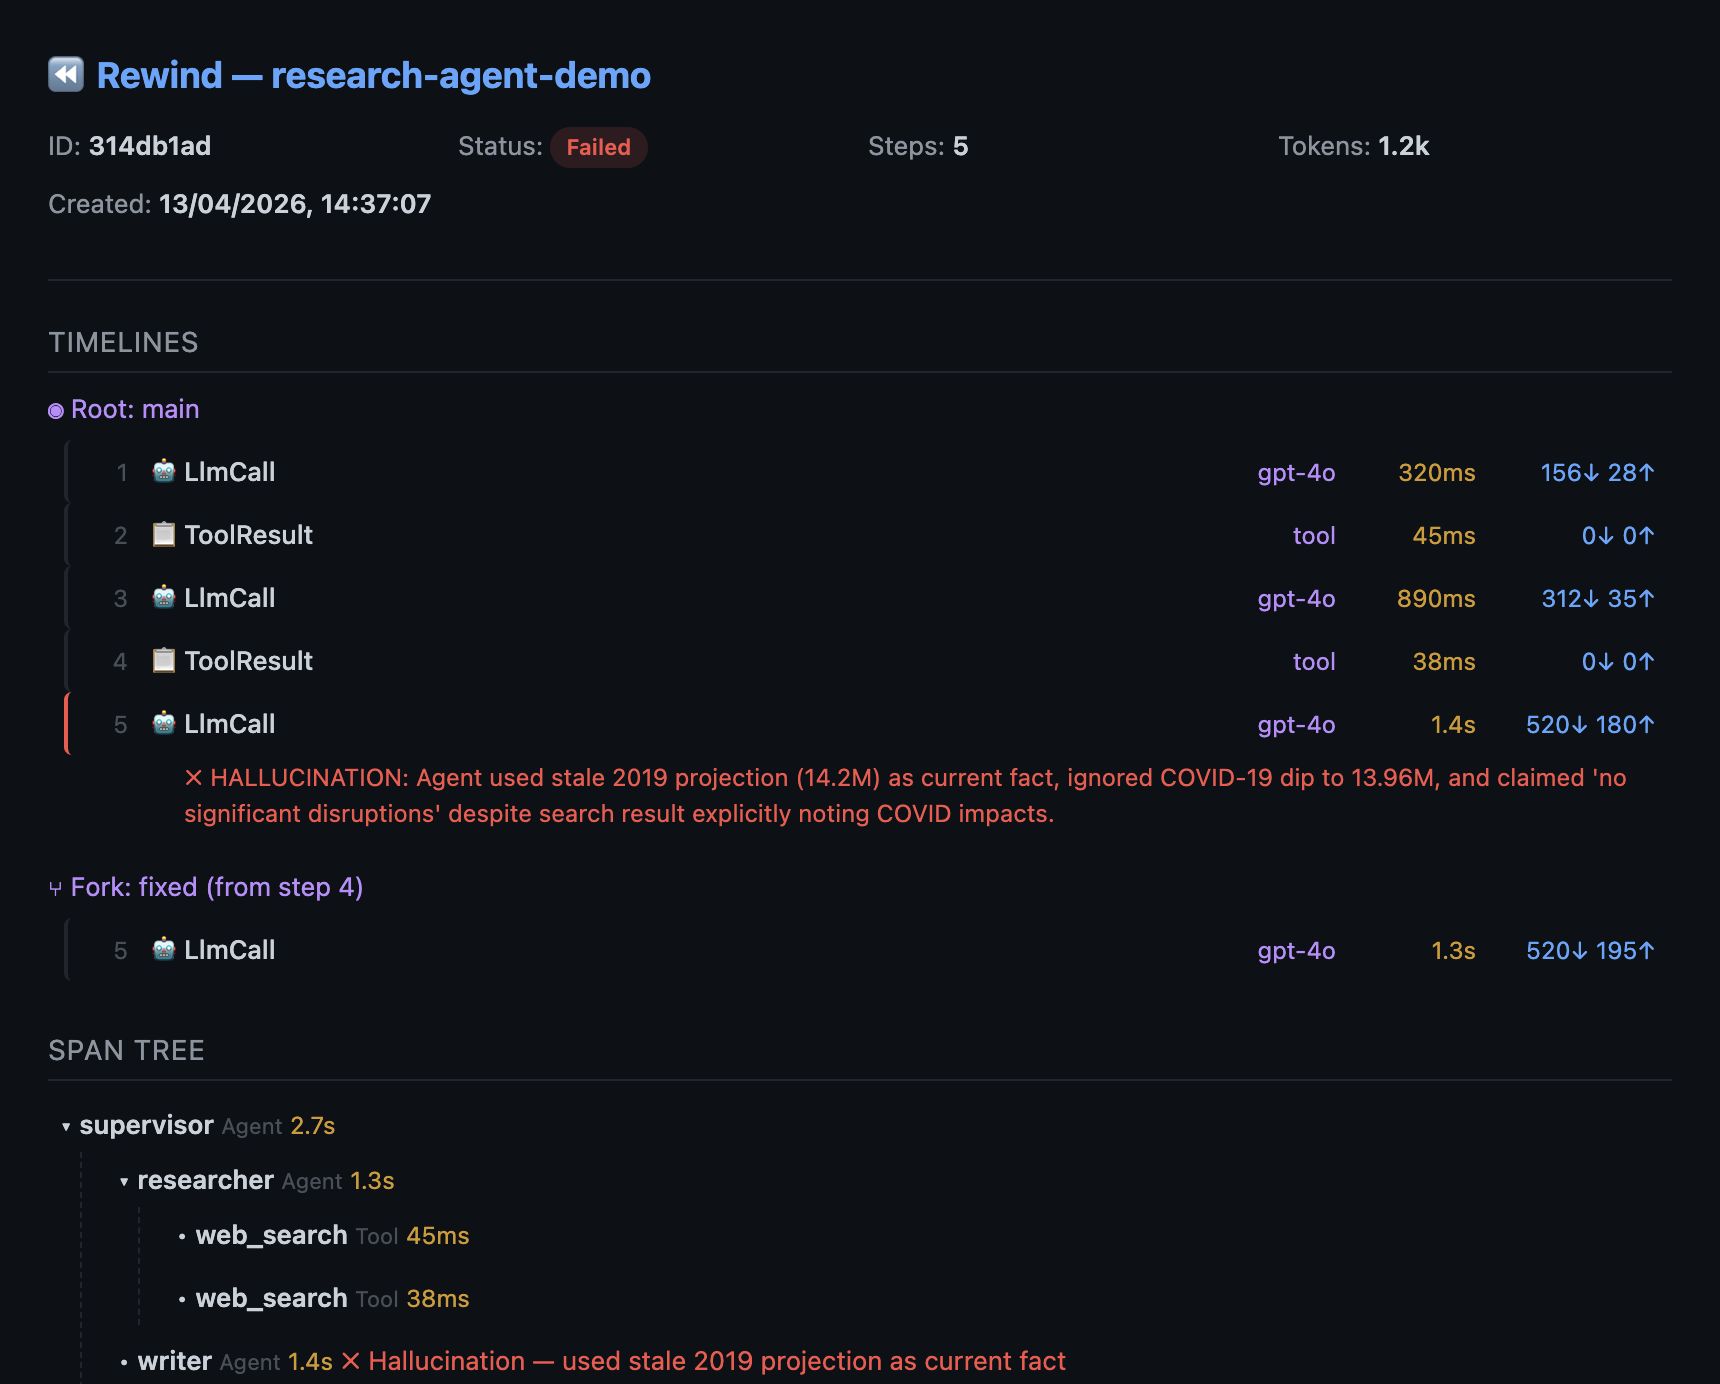
In the show output, find the step marked with an error. That’s your fork point. Fix your code and replay from that step:
rewind replay latest --from 15Steps 1-14 are served from cache (0 tokens, 0 API calls). Only step 15 onward re-runs live with your updated code. A new “fixed” timeline is created alongside the original “main” timeline.
If the fix isn’t right, iterate. Each replay only costs tokens for the steps after the fork point.
Diff the timelines
rewind diff latest main fixedShows exactly where the original and fixed timelines diverge: which steps changed, token count differences, and whether errors were resolved.
Score with LLM-as-judge
rewind eval score latest -e correctness --compare-timelines⏪ Rewind — Timeline Scores
Timeline correctness avg
──────────── ─────────── ──────
main 0.200 0.200
fixed 0.950 0.950
Delta (fixed vs main): +0.75 avg ↑The evaluator compares each timeline’s output against expected results. You can score on correctness, coherence, safety, or any custom criteria.
Set up regression baselines
Turn a known-good session into a baseline:
rewind assert create my-baseline --session latestAfter future code changes, check for regressions:
rewind assert check latest --against my-baselineThis checks step types, models, tool calls, token counts, and error status. Use it in CI with --fail-on-error.
Share the debug session
rewind share latest --include-content -o debug-session.htmlGenerates a self-contained HTML file with the full trace, both timelines, the diff, and the scores. Open in any browser, no install needed. Share via Slack, email, or a PR comment.
Export back to Langfuse
Send the debugged session (with the fix) back to Langfuse for the team dashboard. The export uses the same API keys you set up for import:
rewind export otel latest \
  --endpoint https://cloud.langfuse.com/api/public/otel \
  --header "Authorization: Basic $(echo -n $LANGFUSE_PUBLIC_KEY:$LANGFUSE_SECRET_KEY | base64)"
This exports the session as an OTel trace via OTLP. Works with any OTel-compatible backend (Langfuse, Datadog, Grafana Tempo, Jaeger).
Full workflow summary
# 1. Import the broken trace
rewind import from-langfuse --trace <id>

# 2. Inspect it
rewind show latest

# 3. Fix your code, then replay from the failure
rewind replay latest --from 15

# 4. Prove the fix works
rewind eval score latest -e correctness --compare-timelines

# 5. Share the proof
rewind share latest --include-content -o debug-session.html

# 6. Export back to Langfuse (set auth header as shown above)
rewind export otel latest --endpoint https://cloud.langfuse.com/api/public/otel
Try it without Langfuse
You don’t need a Langfuse account to try the debugging workflow:
rewind demo && rewind show latestThis seeds a 5-step research agent session with a hallucination at step 5. Try replay, diff, eval score, and share on it.